
- The Fed has officially confirmed that we are in the midst of a paradigm shift, and that it may well take another decade for interest rates to return to levels close to their historical average. To the long-term secular trends that reduce inflation – mainly demographics, globalization and digitalization – we must add the deflationary impact caused by the pandemic.
- We are in unchartered territory, and although comparing with the past is always wise, in this case it can also be misleading. Stock valuations look expensive when compared to their historical averages, but the same cannot be said if normalized by extremely low interest rates.
- As rates decline, their impact on stock valuations increases exponentially. This effect should be more pronounced the higher the earnings growth, which coincidentally is what we are witnessing. However, as valuations inflate, they also become much more vulnerable to changes in expectations. There will be no choice but to learn to live with frequent episodes of volatility, such as those experienced in recent days.
Mathematics tells us that when any positive number is divided by a quantity that approaches zero, the result of the quotient goes to infinity; what is known as a singularity.
Likewise, standard valuation models define the price of a stock as the sum of future cash flows, discounted at a certain rate. At the limit, if the cash flows are assumed to continue indefinitely, their present value (PV) can be assimilated to a geometric series that converges to the following formula: PV = CF x (1 + g) / (r – g), where g is the growth rate of cash flows (CF), and r is the discount rate.
Given that interest rates have fallen dramatically over the past four decades (and have even turned negative in some of the major currencies) one might wonder if the discount rate is getting so close to the rate of growth in earnings that stock prices could soon approach infinity.
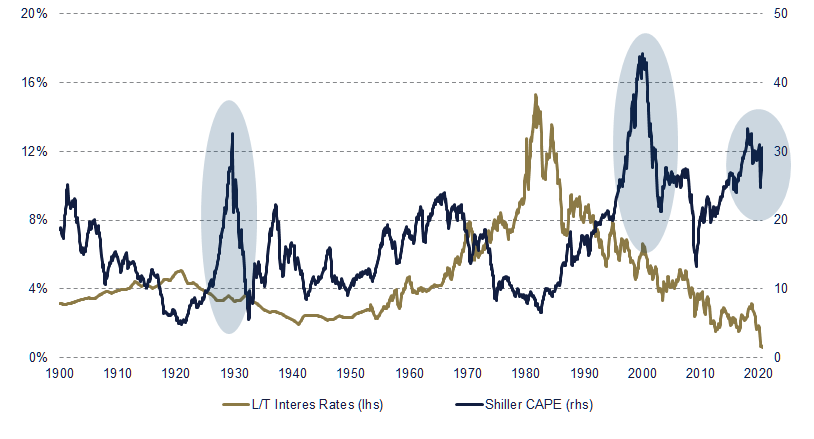
There have only been three interludes in financial history during which, if we look at multiples of price over earnings, it could be argued that stock prices got off the ground (see chart below). The first two took place around the years 1929 and 2000, both times of frenzied speculation that, as we know, ended in tears. The third occurrence is happening right now, with a new breed of tech stocks leading the gains. And the question that naturally arises is, will this time really be different, or will history repeat itself again?
To answer this question, one needs to look at the interplay between the two main variables in the equation. A high growth rate has a powerful multiplier effect on future cash flows. However, no investor can realistically project high growth ad infinitum. Normally, companies follow a path of growth, maturity and decline, reducing their growth in the final stage to a rate closer to that of the overall economy.
Of course, there are exceptions to this rule, and you can find companies like Amazon and Microsoft that manage to sustain high growth rates for decades. But even these companies can be vulnerable to valuation excesses – investors who bought Amazon at the peak of 1999 had to endure ten years of pain before they got their money back.
This is a cautionary tale to those who today believe that stock prices should continue to rise, solely on the grounds that the current wave of innovation is inherently superior to the previous one. When, in fact, investors should look at the other variable in the formula, to trust that this time is really different.
To understand why, it is necessary to overcome two behavioral biases. The first has two to do with our tendency to expect phenomena to evolve cyclically. In fact, the assumption that interest rates are a mean-reverting variable is a fundamental tenet of modern finance. Well, now we know that this is not true, or that it can take a lifetime to witness a reversion to its average.
From this perspective, we can better understand why we are in a completely different environment from that of the Internet bubble. Back then, the yield on the 10-year US Treasury stood at 6.7%, while today it is around 0.7%. Furthermore, in 2000 no one could even imagine that interest rates would drop so much over the next few decades, whereas today all forecasts (including those of the Fed) indicate that interest rates will remain very low for a very long period of time.
The second bias that prevents us from believing that the stock market is not expensive is linear thinking. Our brain tends to see linear relationships between variables. We know that reality is more complex, but linearity is usually a good enough approximation for most phenomena; at least within a certain range. This also goes for the relationship between interest rates and asset prices. When the discount rate is relatively high, a decrease of, say, 11% to 10%, has an impact roughly equivalent to a drop from 9% to 8%. But as rates begin to approach zero, the same percentage change causes an ever greater increase in price. Or visually, what within a certain range resembled a line, becomes a convex parabola (see graph below).
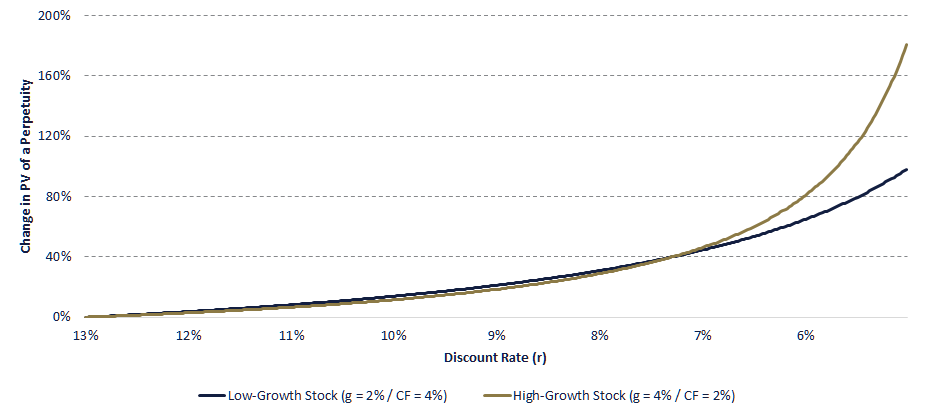
Arguably, this „convexity“ would be playing an important role in the counter-intuitiveness of indices reaching new highs amid the pandemic. And a clue to this can be seen in the strong rally in growth stocks. This is what we should expect as we approach the region of non-linearity since, as the graph above shows, convexity is more pronounced for stocks that exhibit high earnings growth rates (since long-term cash flows become much more valuable if discounted at low rates).
Price distortions caused by razor-thin interest rates are not unique to stocks. Any yield-generating asset, from bonds to real estate, has benefited from the drop in interest rates in recent decades. Getting here has been relatively easy, but at the cost of turning asset allocation increasingly difficult. This is because as we approach the singularity, asset classes become increasingly correlated, and sensitive to movements in interest rates. Therefore, relatively minor changes in market expectations can have a disproportionate effect on portfolios.
There is a certain likelihood that the party will keep going on, with the Fed being forced to adopt negative interest rates. But investors should be wary of these type of returns, as each notch down will further exacerbate the inherent instability of the system. The structural factors that depress interest rates are not going to go away anytime soon, but life in infinity will not be easy, and investors must prepare to endure much more frequent bouts of market volatility.
Fernando de Frutos – Chief Investment Officer
* This document is for information purposes only and does not constitute, and may not be construed as, a recommendation, offer or solicitation to buy or sell any securities and/or assets mentioned herein. Nor may the information contained herein be considered as definitive, because it is subject to unforeseeable changes and amendments.
Past performance does not guarantee future performance, and none of the information is intended to suggest that any of the returns set forth herein will be obtained in the future.
The fact that BCM can provide information regarding the status, development, evaluation, etc. in relation to markets or specific assets cannot be construed as a commitment or guarantee of performance; and BCM does not assume any liability for the performance of these assets or markets.
Data on investment stocks, their yields and other characteristics are based on or derived from information from reliable sources, which are generally available to the general public, and do not represent a commitment, warranty or liability of BCM.